Practical skills · 25 September 2026 · 6 min read
Physics graphs: best-fit lines, anomalous points and gradients explained
A graph is a model of the relationship supported by your measurements. It is not a decoration added after a table. Decisions about axes, fitting and gradients can change the physical conclusion, even when every original reading is correct.
This guide follows a fictional force–extension investigation and then shows where the same method must change for curved graphs. It complements the interactive graph-skills resource: here the focus is explaining the choices you make, especially when the measurements are imperfect.
Choose axes and scales that keep the data readable
For a typical investigation, place the independent variable on the horizontal axis and the dependent variable on the vertical axis, unless the task specifies otherwise. Label each with the measured quantity and its unit. If you convert centimetres to metres before plotting, the numerical values and the axis label must both reflect that conversion.
Use a scale that spreads the points over a useful part of the grid and allows straightforward interpolation. Awkward intervals make plotting and reading harder. The axes do not always need to start at zero, although the chosen range should show the relationship honestly. If an intercept matters, leave enough space to find it and make any break or offset in the scale unmistakable.
Fit the trend rather than drawing dot to dot
A best-fit straight line summarises data that support a linear relationship. With ordinary scatter of similar size, seek a balanced distribution around the line instead of insisting that it passes through the first and last readings. A dot-to-dot zigzag treats each small fluctuation as a physical change and usually does not represent the underlying relationship being investigated.
Check whether a straight line is appropriate at all. A smooth, systematic curve in the data may be evidence of a nonlinear relationship, rather than poor experimental technique. Follow the question’s instruction if it asks for a particular fit. At A-Level, transformed variables may make a model linear, but you must explain the transformation and interpret the gradient in those new variables.
Calculate a gradient from the fitted line
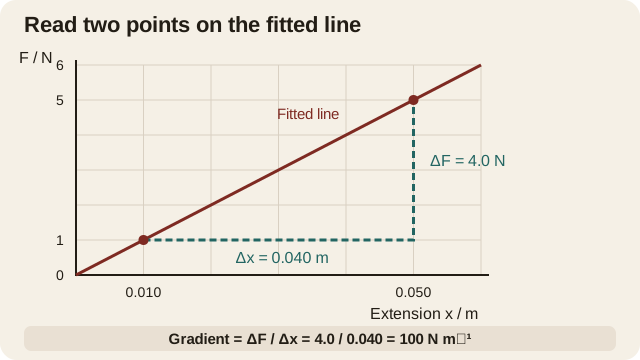
Suppose force F is on the vertical axis and extension x in metres is on the horizontal axis. Two convenient points on the fitted line are (0.010 m, 1.0 N) and (0.050 m, 5.0 N). The gradient is ΔF/Δx = (5.0 − 1.0)/(0.050 − 0.010) = 4.0/0.040 = 100 N m⁻¹. For a spring obeying F = kx, this gradient represents the spring constant.
Choose well-separated points on the fitted line, even when they are not original measured points. A large triangle makes a small coordinate-reading uncertainty a smaller fraction of the coordinate differences. Show the chosen coordinates and subtraction. If you reverse the axes, the gradient becomes Δx/ΔF with units m N⁻¹ and represents 1/k, so the physical interpretation changes too.
Treat an anomalous point as a question to investigate
An anomalous reading is unexpectedly far from the overall pattern. First check transcription, unit conversion and plotting. If the experiment can be repeated, remeasure at that setting and inspect the apparatus. A point that appears inconvenient should not be erased simply to make a theory look correct.
Distinguish one isolated point from a whole sequence bending away from a line. In a spring experiment, several high-force readings departing from the initial linear relationship could indicate that the model no longer applies over that range. Describe the evidence and follow the instructions about fitting or excluding data. If a reading is omitted for a justified reason, record that decision rather than silently changing the dataset.
Interpret the intercept and recognise curved graphs
Do not assume every rising straight line means direct proportionality. A linear relation can have the form y = mx + c with a nonzero intercept. A force-versus-extension graph should ideally pass through the origin in the Hooke’s-law region, but an observed offset might suggest an incorrect extension zero or another methodological issue. Investigate it rather than forcing the graph to agree.
For a curved graph, a secant gradient gives an average rate of change between two points; a tangent gradient estimates the instantaneous rate at a chosen point. Draw the tangent at that point, then use a large triangle on the tangent itself. The triangle’s points need not lie on the original curve. State the physical quantity and units represented by the gradient in that particular graph.
Check the physical meaning before accepting the number
A gradient is not automatically speed, acceleration or resistance. Its meaning comes from the axes and the physical equation. A distance–time gradient has units of speed; a velocity–time gradient has units of acceleration. For an ohmic conductor at constant temperature, a voltage-versus-current gradient gives resistance. For a curved component characteristic, the tangent gradient is not generally the same as V/I at that point; swapping the axes also changes the interpretation.
Finish a graph calculation by checking the sign, unit and plausible size. Then state the range over which your conclusion applies. Extrapolating well beyond measured values can be unreliable because the system may change behaviour. For revision, redraw one graph with the axes reversed and explain the new gradient. That small exercise tests understanding far more thoroughly than memorising ‘rise over run’ alone.
Questions, explained
Choose a question for a direct answer, then explore the explanation and supporting resources. Each answer has its own link to save or share.
Should I use plotted data points or points on the best-fit line for a gradient?
Use two well-separated points on the fitted line when asked for its gradient. They need not be original readings. The fitted line represents the overall relationship, whereas a gradient between individual readings can be strongly affected by scatter. Show both coordinate differences, use the actual axis scales, and derive the gradient’s unit from the vertical unit divided by the horizontal unit.
Does a line of best fit have to pass through the origin?
No. A straight line can have a nonzero intercept. Pass it through the origin only when the task or justified model and evidence support that choice. Even when a model predicts zero, an observed offset may reveal a measurement problem that needs discussing. Forcing the line through zero can hide that evidence and change the calculated gradient.
Can I ignore an anomalous result on a physics graph?
Do not discard a point just because it weakens the expected pattern. Check the recorded value, conversion and plotting first, and repeat the measurement if possible. Follow the question’s instructions and explain any justified exclusion. Several neighbouring points departing systematically from a straight line may reveal a changing relationship rather than separate anomalous readings.