A-Level · 25 September 2026 · 6 min read
Photoelectric-effect questions: frequency, intensity and energy graphs
A photoelectric question often changes one variable and asks you to explain a different observation. Frequency, intensity, photocurrent and maximum electron kinetic energy are connected, but they are not interchangeable. A precise answer follows the energy of one photon before considering how many photons arrive.
The examples below use the introductory single-photon model relevant to International AS Physics. They are original questions designed to make the reasoning visible. Use the constants supplied in your own examination question when reproducing a calculation, since small rounding differences can change the last reported digit.
Start with an energy budget for one electron
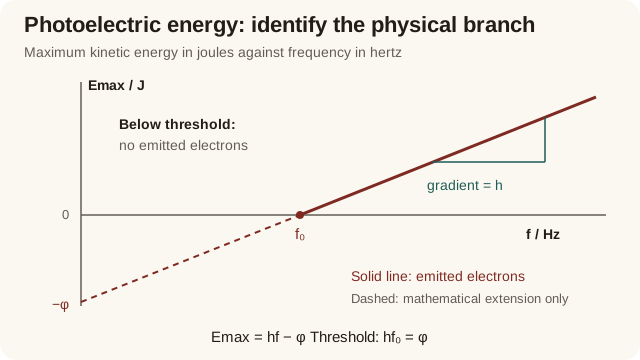
A photon of frequency f carries energy hf. The work function φ is the minimum energy required to release an electron from the material's surface. For the fastest emitted electrons, Einstein's equation gives Eₖ,max = hf − φ. Electrons that lose additional energy before escaping can emerge with less kinetic energy, which is why the equation describes a maximum.
If hf is below φ, this model predicts no emission, rather than electrons with negative kinetic energy. At the threshold frequency f₀, hf₀ = φ. A shorter wavelength means a higher frequency because c = fλ in vacuum, so sufficiently short wavelengths can cause emission where a longer wavelength cannot. State this energy comparison explicitly rather than relying on the colour name alone.
Convert electronvolts before combining quantities
Take a work function of 2.20 eV and incident light of frequency 6.50 × 10¹⁴ Hz. Using h = 6.63 × 10⁻³⁴ J s and 1 eV = 1.60 × 10⁻¹⁹ J, the work function is 3.52 × 10⁻¹⁹ J. The photon energy is 4.31 × 10⁻¹⁹ J, so the maximum electron kinetic energy is approximately 7.90 × 10⁻²⁰ J.
Dividing by the joules-per-electronvolt conversion gives about 0.493 eV. Do not subtract 2.20 directly from a photon energy expressed in joules. An electronvolt is an energy unit, not an electric potential: it describes the energy change of one elementary charge moving through one volt. Keeping a unit on every line makes this distinction visible.
Distinguish a frequency change from an intensity change
At fixed frequency above threshold, increasing intensity increases the number of incident photons per unit time on the same illuminated area. If the collection conditions are unchanged, this can increase the emission rate and measured photocurrent. It does not increase hf, so the maximum kinetic energy remains the same in the standard model.
Increasing frequency while holding intensity fixed is a different change. Each photon has more energy, but the same incident energy per second is now carried by fewer photons. Maximum kinetic energy rises, while a simple claim that current must rise is unjustified. Photocurrent also depends on emission efficiency and collection conditions, so identify what the question says is held constant before predicting it.
Read the slope and intercepts of the energy graph
For a plot of maximum kinetic energy in joules against frequency in hertz, Eₖ,max = hf − φ is a straight line of gradient h. The frequency-axis intercept is f₀ = φ/h. Extrapolating the line backwards gives a vertical intercept of −φ, but that extension does not represent physically emitted electrons with negative kinetic energy.
Changing the metal changes its work function and therefore shifts the threshold and intercept. It does not change Planck's constant, so the lines are parallel when the same axes and units are used. If energy is plotted in electronvolts rather than joules, the numerical slope is h divided by the joules-per-electronvolt conversion, not h in J s.
Connect the energy calculation to stopping potential
A retarding potential can reduce the collected photocurrent by preventing emitted electrons from reaching the collector. At the stopping potential magnitude Vₛ, even the fastest electrons are stopped, so eVₛ = Eₖ,max. For the numerical example, Vₛ is about 0.493 V. The equality connects an electric energy change to the maximum kinetic energy, not to the work function alone.
Write the stopping potential as a positive magnitude unless the question defines a signed circuit voltage. A graph of stopping-potential magnitude against frequency has slope h/e and frequency-axis intercept f₀. This differs from the kinetic-energy graph's slope because the vertical quantity has changed. Reading the axis title carefully avoids an otherwise correct calculation with the wrong constant.
Practise a threshold comparison and explain the outcome
A surface has threshold frequency 5.0 × 10¹⁴ Hz. Light of frequency 4.0 × 10¹⁴ Hz is made ten times more intense. Does emission begin in the standard model? No: each photon still has less than the required energy. Increasing the number of insufficient-energy photons does not change the energy of one photon in this single-photon explanation.
Now illuminate the surface with 7.0 × 10¹⁴ Hz light. The maximum kinetic energy is h(f − f₀) = 6.63 × 10⁻³⁴ × 2.0 × 10¹⁴ = 1.33 × 10⁻¹⁹ J. Explain why the difference in frequencies appears: the threshold part supplies the work function, and the remaining photon energy becomes kinetic energy for the fastest electrons.
Questions, explained
Choose a question for a direct answer, then explore the explanation and supporting resources. Each answer has its own link to save or share.
Why can brighter light fail to release photoelectrons?
In the standard single-photon model, an electron must receive enough energy from one photon to overcome the work function. Brightening light at the same frequency increases the photon arrival rate but does not increase photon energy hf. If the frequency remains below threshold, emission still does not occur within this model, regardless of the increased number of arriving photons.
Why do different metals produce parallel photoelectric energy graphs?
On identical axes of maximum kinetic energy in joules against frequency in hertz, the gradient is Planck's constant h, which is independent of the metal. Different work functions change the intercept and threshold frequency instead. This explanation depends on using the same vertical quantity and units; a stopping-potential graph has gradient h/e, so it should not be mixed with an energy graph.
What should I write if hf minus the work function is negative?
State that the photon energy is below the work function and no photoelectrons are emitted in the single-photon model. Do not report a negative maximum kinetic energy. The negative algebraic result tells you the emission condition has not been met; the straight line's extension below zero is a mathematical extrapolation rather than a physical electron-energy range.